The Question Most IT Leaders Can't Actually Answer
It's a fair question, and most instances already hold the answer. Response times, backlog, first contact resolution, SLA performance: the data exists inside the instance. What's usually missing isn't the data. It's looking at it as a trend instead of a monthly snapshot.
That gap has a specific cause, and it usually isn't a missing tool.
Licensed and Sitting Idle
Performance Analytics, the KPI and trend engine that sits inside ServiceNow's broader Platform Analytics suite, ships with a large share of ServiceNow deployments, often bundled into a Pro package or licensed standalone. In our experience, most of it goes unused. Not because it lacks value. Because nobody set it up properly, and the data it's sitting on never gets looked at.
That's a real gap, not a minor one. Configured properly, it turns your ServiceNow instance into a genuine source of operational insight instead of just a system of record.
The KPIs That Actually Move the Needle
Not every metric is worth tracking. The ones that consistently create fast, measurable impact:
Time to Resolve. How fast is service actually restored, and how does that vary across teams, services, and priority?
Backlog development. Is work being kept up with, or is debt quietly accumulating in the form of ageing open cases?
First Contact Resolution. What share of requests get resolved on first contact, and what does that mean for cost and user experience?
SLA compliance, tracked as a trend. Not just whether targets are met this month, but how that's moved over time, and why.
Demand versus capacity. Is the team keeping pace with demand, or running in permanent reactive mode?
Satisfaction over time. Not a standalone score, but the relationship between perceived quality and actual performance.
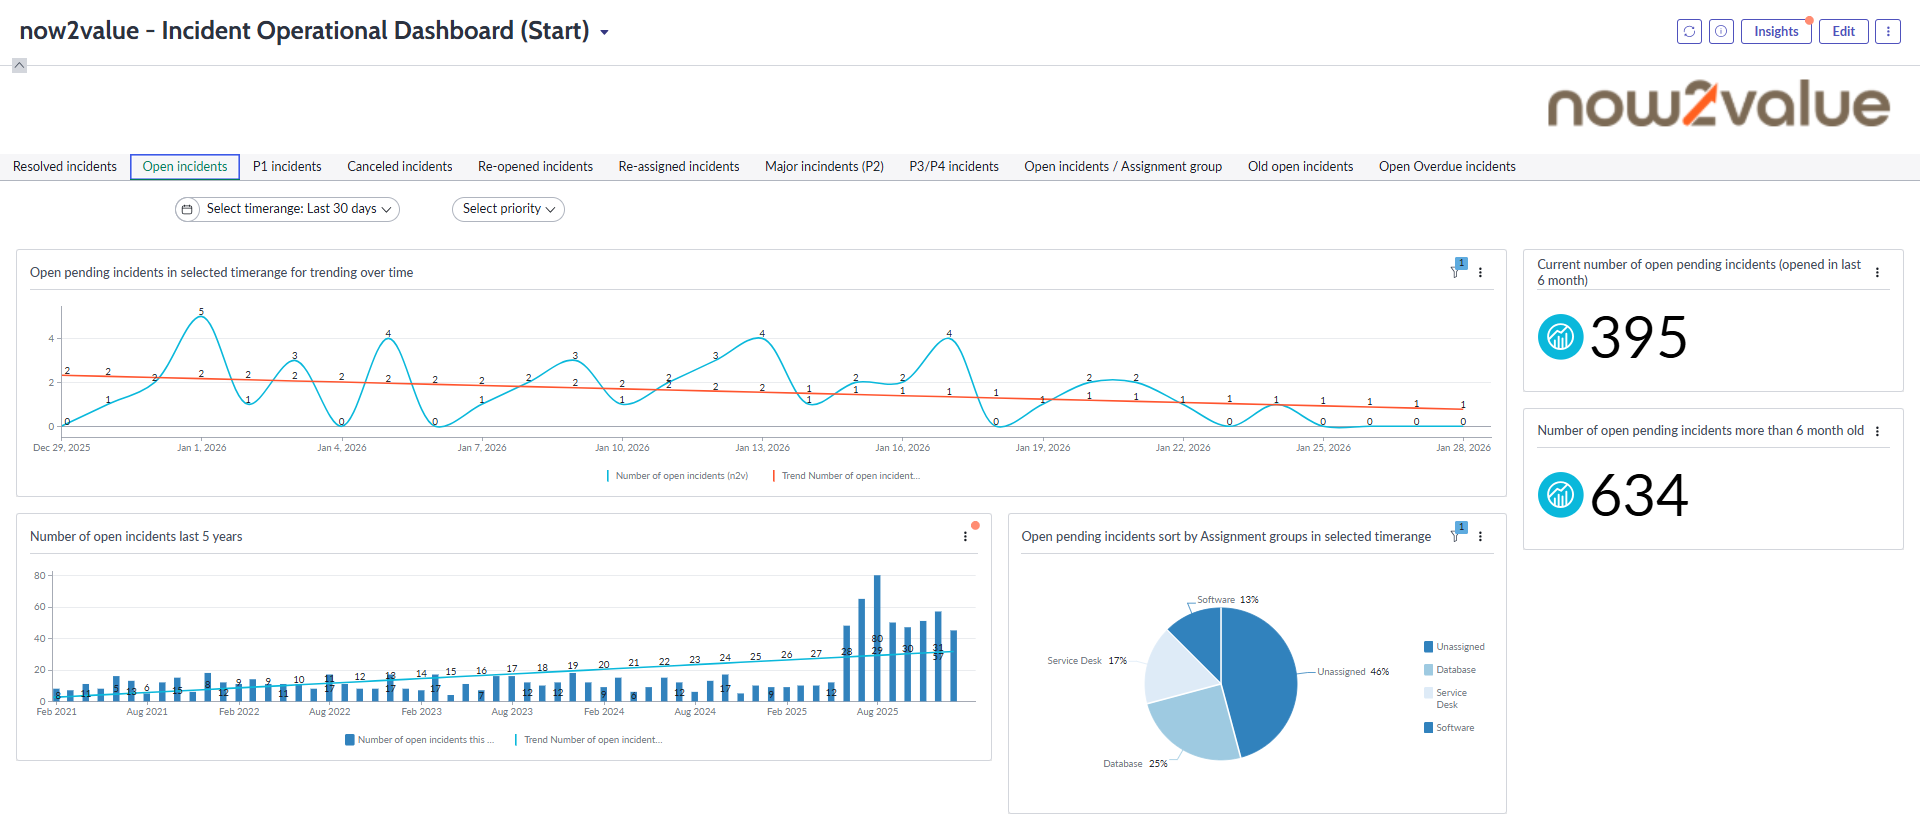
Why the Trend Matters More Than the Number
A single KPI reading is a fact. A KPI followed over time is a warning system. The value isn't in knowing that SLA compliance is 94% this month. It's in seeing that it's been sliding for three months and asking why, before a customer asks first.
We've written before about why a dashboard is a window and a report is a receipt. That distinction still holds. But it raises a separate question: when you are using a dashboard, are you actually using it for what it's best at? A dashboard that only ever shows today's number is a window with the blinds half down. A dashboard built around trend data is what puts a team ahead of a problem instead of behind one.
The interesting part isn't the individual KPI itself. It's the insight that emerges when data is put into context and followed over time.
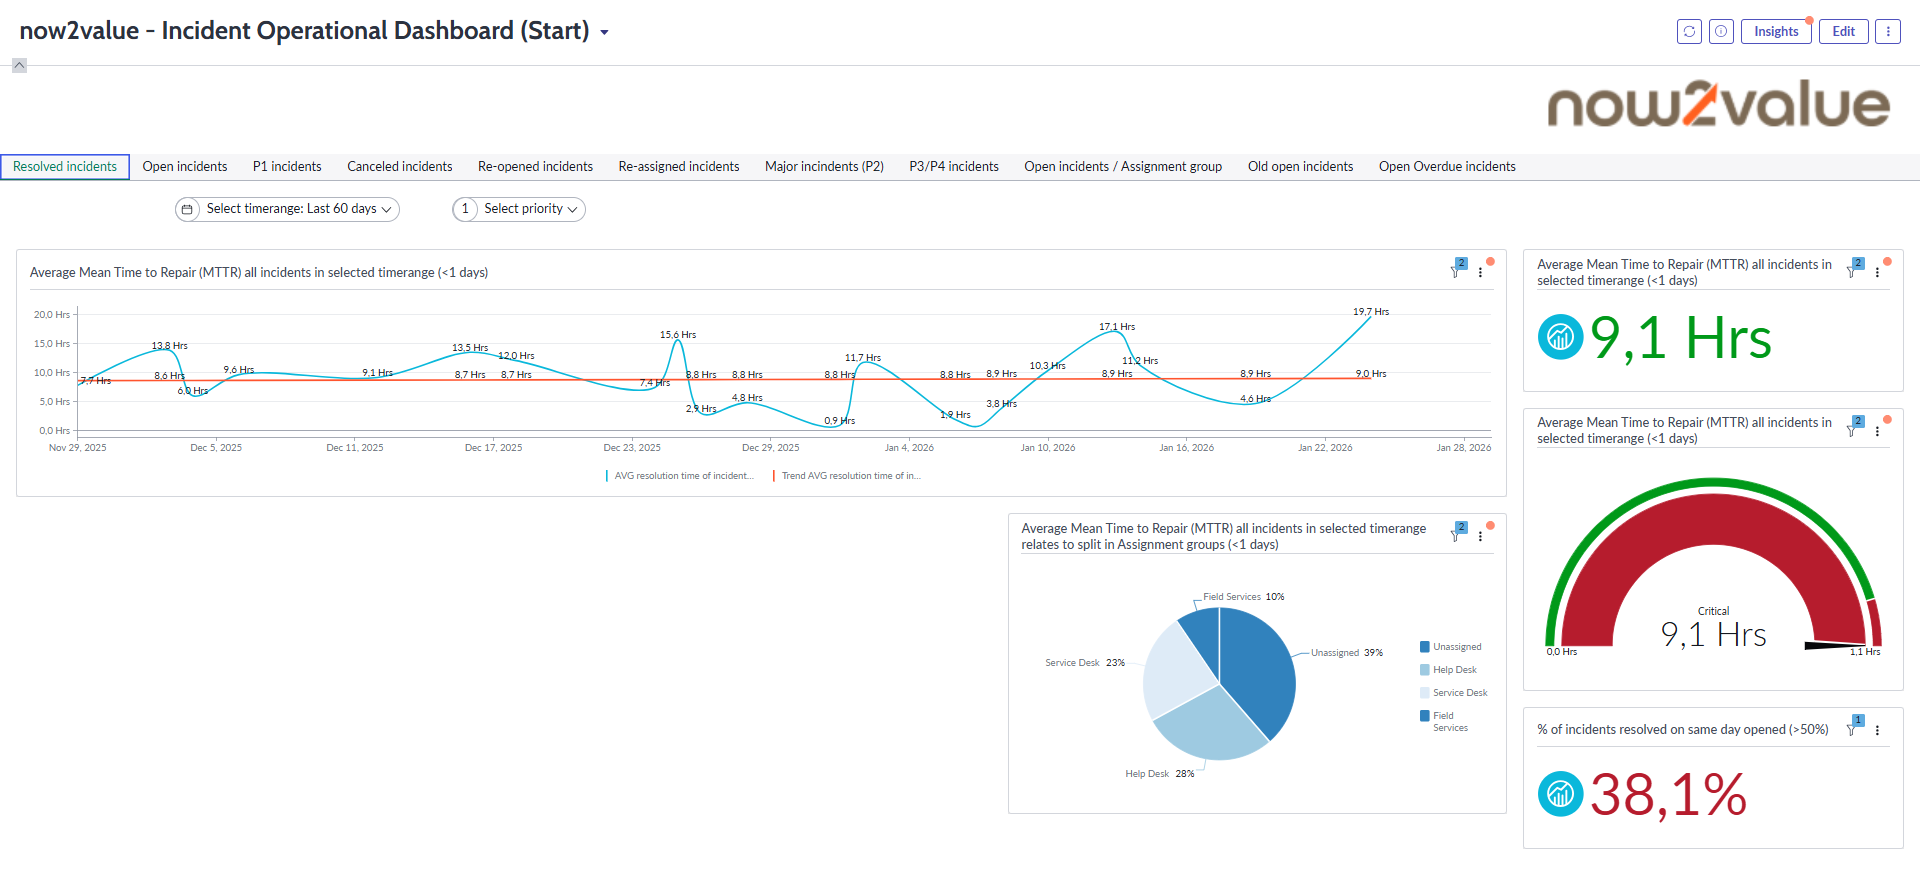
What This Looks Like Drilled Down
The same approach holds at every level of detail, not just the headline numbers. A P1 dashboard broken down by assignment group and category turns "how are we doing on critical incidents" from a single average into a picture of exactly where performance is strong and where it isn't.
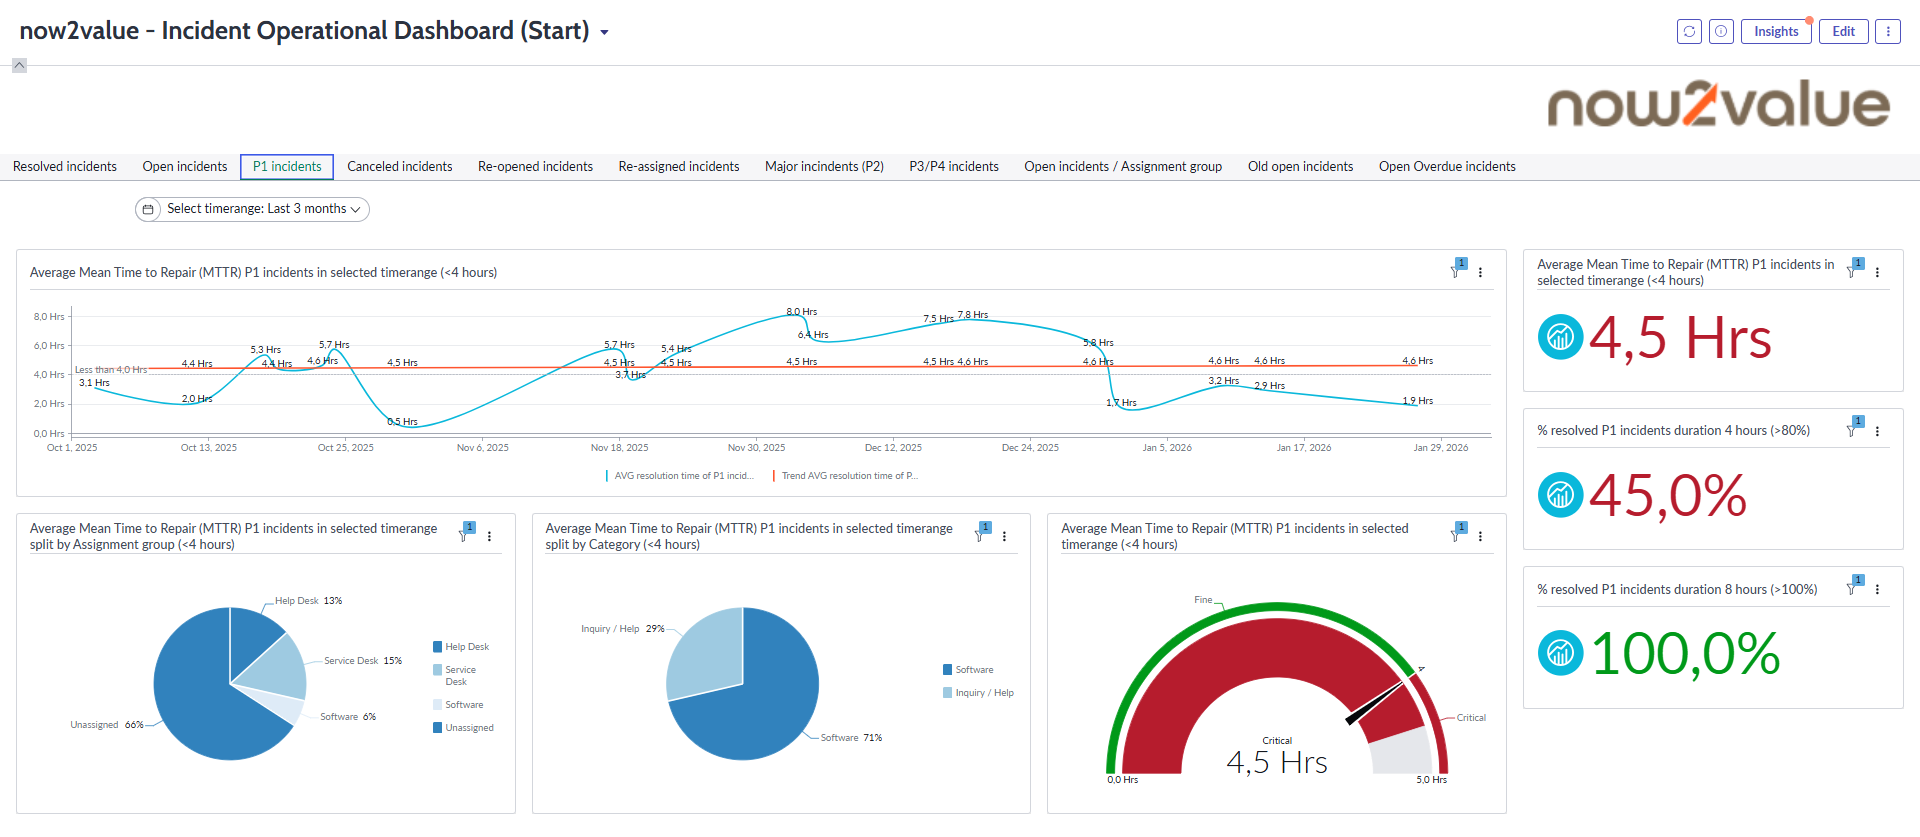
Many customers already paid for this. Most instances just never turn it on properly.
The underlying data already exists in ServiceNow. What's usually missing is the configuration: the right indicators defined, the right breakdowns set up, data collection actually running. That's a setup task, not a new platform investment.
The Same Data Also Points to Where AI Pays Off First
Once this data exists, it does more than flag where operations are drifting. The category and source breakdowns already covered here, first contact resolution, time to resolve, and where volume actually comes from, are the same signals that show where GenAI and agentic automation would create value immediately, rather than being a guess.
A category with high volume and low variation is a candidate for a GenAI-drafted resolution or a virtual agent that deflects it before it reaches a person. A category where handling time runs long despite the case itself being simple points to automated triage, an agent that pulls context and drafts a first response before a human ever picks it up. A source channel carrying a disproportionate share of low complexity volume shows exactly where a virtual agent would have the most reach.
The shortlist writes itself, instead of being guessed.
The categories your breakdown already flags as high volume and repetitive are worth piloting first, not because they're easy, but because the data proves the opportunity before a single hour of AI development starts.
Getting There Doesn't Take Long
Where the licence is already there, the gap to real insight is usually just proper setup, not a large project. Where it isn't, that's worth knowing too, before assuming the answer is a bigger platform investment.
Is your Performance Analytics licence earning its keep?
Let's find out. We can tell you quickly whether it's a configuration problem or a genuine gap.
Speak with us